Monitor App Usage
This page shows how to build an Appsmith app to monitor other Appsmith applications by fetching audit logs and displaying data.
Prerequisites
- Appsmith instance with access to Admin setting.
- Access to the MongoDB URI, either embedded with Appsmith or external.
Fetch usage data
Follow these steps to connect your MongoDB and create queries to fetch usage data:
-
In Appsmith, open the Admin settings page from the top-right corner.
-
Open the Advanced tab, and copy the MongoDB URI. If the URI is not available, open the environment variable file (
docker.envfor Docker orvalues.yamlfor Kubernetes) and copy theAPPSMITH_DB_URL. The URI looks like:
mongodb://appsmith:Oabc123@localhost:27017/appsmith
- Create a new MongoDB datasource using the MongoDB URI:
-
For external MongoDB, use the provided URI or configure it according to your MongoDB setup.
-
For embedded MongoDB (internal), append
?authsource=appsmithto the end of the URI, like this:
mongodb://appsmith:Oabc123@localhost:27017/appsmith?authsource=appsmith
For more information on how to configure the MongoDB datasource, see MongoDB.
- Create a new query to fetch logs from the
auditlogCollection and configure the parameters as needed.
-
For application lifecycle events, use
application.created,application.updated,application.deleted, andapplication.deployedto track when applications are created, modified, deleted, or deployed. -
To keep track of user actions, use
user.logged_in,user.logged_out, anduser.signed_upto log user sign-ins, sign-outs, and new user registrations. -
To track page activities, use
page.created,page.viewed,page.updated, andpage.deletedto monitor new page creation, views, edits, and deletions.
For more information on how logs are stored, see Log contents.
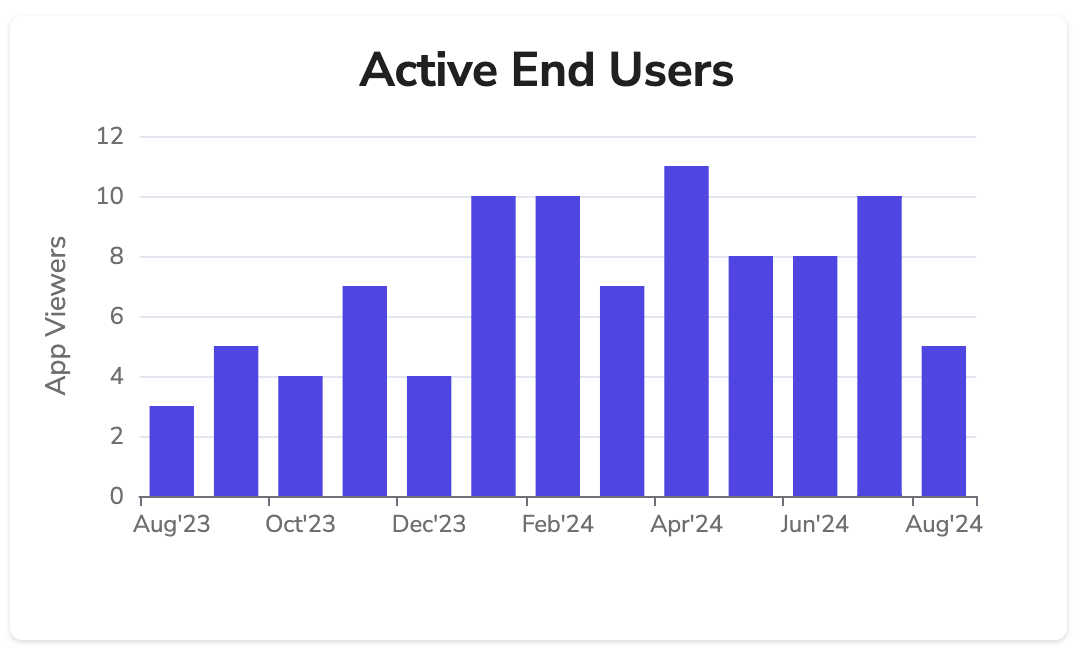
Example: To display the number of active end users per month on a Chart widget, set the Command as Aggregate and configure the query as shown below:
// This query counts the number of unique active users per month and year, excluding anonymous users, and sorts the results by date.
[
  {
    $match: {
      "application.mode": "view", // Only include records where the application is in view mode
      "user.email": {
        "$not": {
          "$regex": "anonymousUser", // Exclude records with anonymous users
          "$options": "i" // Case-insensitive matching
        }
      }
    }
  },
  {
    $group: {
      _id: {
        month: { $month: { $toDate: "$timestamp" } }, // Extract month from timestamp
        year: { $year: { $toDate: "$timestamp" } } // Extract year from timestamp
      },
      uniqueUsers: { $addToSet: "$user.email" } // Group by unique user emails
    }
  },
  {
    $project: {
      _id: 0,
      month: "$_id.month",
      year: "$_id.year",
      count: { $size: "$uniqueUsers" } // Count the number of unique users
    }
  },
  {
    $sort: { year: 1, month: 1 } // Sort results by year and month in ascending order
  }
]
- Drag a Chart widget and set its Series Data property to display the data, like:
{{getAppViewersByMonth.data.map((item) => ({ x: Utils.formatDate(item), y: item.count }))}}
Sample App
- Usage Overview: Get platform activity for the last 30 days.
- Monthly Usage: A page that shows detailed app usage for the month.
- Raw Logs: A page that displays raw logs in a tabular format.